Essential Question: What has your research shown?
Please Click here to access my paper. I did not want to fill up my blog with this long paper. It is a google doc. I did include lots of tables at the back. You don't have to read them unless you want to.
Showing posts with label EDET 636: Essential Questions. Show all posts
Showing posts with label EDET 636: Essential Questions. Show all posts
Friday, December 4, 2015

Thursday, November 19, 2015
Week #12
Essential Question: What are the characteristics of an engaging Action Research Report?
I picked the 2 articles that were about science because I am a science teacher. The first thing I did after that was look at the page lengths. I planned to just skim them, but ended up reading more than expected. From this I gained a few insights as to what might spark someone's interest. The first being that it is very important to have an engaging introduction. This is what readers get to first. You can either make it something that really hooks the reader into wanting to read more or it could be a total dud causing the reader to disregard your work. Tracy (2002) described his situation so well that I thought he must have been in my classroom. “As I struggled to explain mitosis to a group of very low English level English Language Learners I realized that they had no idea what I was saying. Desperately I floundered to try a different approach.” I feel like I am doing this constantly with my middle school students. He couldn’t have described it any more perfectly. Once I read that I wanted to keep going and know more. He also brings in the humor that sometimes comes into teaching by sharing a personal story. This personal story was easy to relate to as I think every teacher has probably had a similar experience of doing something and it comes out totally wrong.
The second article I read by Herman (2002) took a little longer to hook me. It didn’t really seem to relate to me but I read on anyway. It didn’t take long to get to something intriguing, on the second page she talked about challenges. One really stuck out to me, and I could relate. “Students would get up and walk around when they felt like it, even if the teacher or another student was speaking to the class. Or a student would sharpen a pencil during another student’s presentation.” I frequently have this problem and have to stop the class to talk with students.
With both articles I was engaged when I could relate. I think this seems to be a huge part of the engagement. Describing something with enough detail, but not too much, so that someone else could feel like they are in your shoes.
I also think it is very important at the end to discuss implications. According to Action Research Projects (2002), “The implications for your findings might consider a set of next steps you want to take, additional research that needs to be done, and/or how your findings relate to your school or teaching context.” I think this really engages a reader to think more critically and stirs their imagination. At least for me, I start to think about what I could do differently.
References
"Action Research Projects." Action Research Projects: Exemplar Projects - LMTIP. 2002. Web. 20 Nov. 2015. <https://gse.gmu.edu/research/lmtip/arp/ex>.
Hermann, K. (2002, June 1). Teaching Science to High School Students Who Have Limited Formal Schooling.
Tracy, C. (2002, June 1). Assessment: A New Science Teacher’s Attempt to Use Assessment as a Form of Conversation.
Friday, November 13, 2015
Week #11 Blog
Essential Question: How will you format and disseminate your research?
The first step in writing up qualitative research is to figure out who your research is for, your audience. Next you choose the focus. This is where you go back to the purpose of your study. “The focus “states a purpose and then fulfills the promise. Coming up with a focus means deciding what you want to tell your reader. You should be able to state it in a sentence or two” (Merriam & Tisdell, 2015, pp. 271). Before you can even start writing you must go through all of the data you have collected.
There are many barriers to writing. When you write you could be critiqued and this could be good or bad. People may scrutinize you or criticize your ideas. You could even have many flaws in your research and someone may point those out. These things can make you feel inadequate, and defeated (Merriam & Tisdell, 2015, pp. 274). But if you don’t put your work out there no one will ever be able to benefit from the work you did. Öhman and Löfgren give the following advice when writing up your research:
- The report should be easy to understand and clearly contextualized
- Keep short
- Be clear in presenting methods
- Avoid too much detailed descriptions of the results
- Relate your findings with existing knowledge and theory
- Provide a discussion of the applicability for theory development and practice of the research field
There is no format you have to follow when writing up your research. “In standard research reports, the problem that gave rise to the study is laid out early in the report” (Merriam & Tisdell, 2015, pp. 276). This may be in an introductory section where you talk about your framework and include references. Next you may write about the setting of your research. You may choose to include a section about yourself including: your training, experience, philosophical orientation, and biases (Merriam & Tisdell, 2015, pp. 277). A methodology should be included, but where you include it depends on the audience. Every report will list the findings. This is where you write about what you found out from your research. You may choose to discuss your findings in the same section or start a new section to discuss your data. One of the hardest parts it to determine how much data and analysis you should include. “A good rule when considering how much information to include is that readers should have been given enough information to be able to carry out similar research themselves” (Anderson, 2010). In this section if might be of benefit to include displays, charts, or figures. “Keep the number of displays to a minimum; using just a few figures to represent important ideas will draw attention to those ideas” (Merriam & Tisdell, 2015, pp. 284).
According to Pitchforth (1995), you could use the following structure for your paper: introduction, methods, results, discussion and conclusion. I really like how this is laid out and it seems like how I wrote my science lab reports in undergrad. To me it seems the most natural and I plan to use this as my outline. To disseminate my results I really just plan to share with the class and others at my school or in the district who might be interested.
References
Anderson, C. (2010, October 11). Presenting and Evaluating Qualitative Research. Retrieved November 14, 2015, from http://www.ncbi.nlm.nih.gov/pmc/articles/PMC2987281/
Merriam, Sharan B.; Tisdell, Elizabeth J. (2015-07-06). Qualitative Research: A Guide to Design and Implementation (JOSSEY-BASS HIGHER & ADULT EDUCATION SERIES). Wiley. Kindle Edition.
Öhman, A., & Löfgren, M. (n.d.). News and updates. Retrieved November 14, 2015, from http://www.medicaljournals.se/jrm/index.php?option=com_content&view=article&id=27&Itemid=56
Pitchforth, E., Porter, M., Van Tijlingen, E., & Forrest Keenan, K. (1995, December 3). Writing up and presenting qualitative research in family planning and reproductive health care. Retrieved November 14, 2015, from https://lra.le.ac.uk/bitstream/2381/309/1/Qual research paper 4 final revised.pdf
Friday, November 6, 2015
Blog #10-Credibility & Ethics
Essential Question: What primary concerns exist in ethics, validity and reliability in AR? How are you managing these concerns (or how will you) within your study?
Internal validity deals with the question of how research findings match reality. (Merriam & Tisdell, 2015, pp. 242) To measure validity, Lincoln and Gruba (1985) list credibility, transferability, dependability and confirmability as the main categories to assess the validity of a study. Credibility means that the study seems to be true. Transferability is that a study can be applied to another situation. Dependability refers to the ability of a study to be repeated with similar results. Confirmability means that the results are due to the respondents and they were not greatly influenced by the researcher.
In qualitative research “data do not speak for themselves; there is always an interpreter, or a translator” (Merriam & Tisdell, 2015, pp. 242). This means that no matter what we do as a researcher our opinion will always be present. “One cannot observe or measure a phenomenon/ event without changing it” (Merriam & Tisdell, 2015, pp. 242). Even when faced with similar situations people usually have different accounts.
According to Merriam and Tisdell (2015), some ways to increase the validity of a study include: triangulation, respondent validation, adequate time with data, peer review, audit trail, thick descriptions, and maximum variation. If you can get feedback from other sources either through reading the research or talking with others you can filter out some of your opinions. However, “the important feature of triangulation is not the simple combination of different kinds of data, but the attempt to relate them so as to counteract the threats to validity identified in each" (Brown, 2005). This helps you to gain other perspectives that you may not have seen otherwise. Spending time collecting and analyzing data coupled with thick descriptions can help others to see where you are getting your conclusions. “If the findings of a study are consistent with the data presented, the study can be considered dependable” (Merriam & Tisdell, 2015, pp. 252). This also means that the researcher needs to explain their position so others will know where possibles biases may come into play.
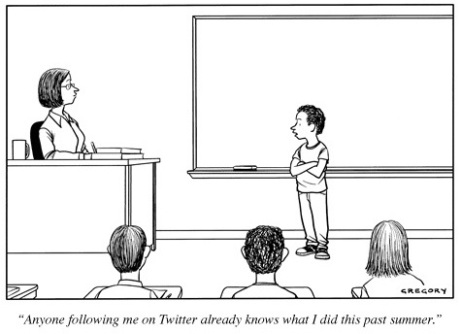
When researching there will always be multiple opinions on what is allowed and what is not. The ethics behind the research is not black and white. There will always be gray areas. I think of biggest concern for my study will be confidentiality and anonymity. With using Twitter my students will be out in the online world. This means that I am not the only one who sees their tweets. I decided to look into the ethics of using Twitter to see if there was anything out there. There wasn’t much but I did come across the suggestion “that scientists never reveal screen names and make research objectives publicly available” (Moyer, 2014). My students are aware that others can see what they are doing and they know that they are posting to Twitter to see if it helps them out in class. They are aware of the basics but not the specifics. I think I will just have to be cautious in writing my conclusions to make sure that I think about their anonymity as I go.
This week I stumbled across another cartoon that made me chuckle. It went right along with my research and the ethical concerns that could come up.
 |
| https://epriego.wordpress.com/2014/05/27/twitter-as-public-evidence-and-the-ethics-of-twitter-research/ |
References
Brown, J. (2005). Questions and answers about language testing statistics: Characteristics of sound qualitative research. JALT Testing & Evaluation SIG Newsletter, 9(2), 31-33. Retrieved from http://jalt.org/test/bro_22.htm
Merriam, Sharan B.; Tisdell, Elizabeth J. (2015-07-06). Qualitative Research: A Guide to Design and Implementation (JOSSEY-BASS HIGHER & ADULT EDUCATION SERIES) Wiley. Kindle Edition.
Moyer, M. (2014). Twitter to Release All Tweets to Scientists. Scientific American, 310(6). Retrieved from http://www.scientificamerican.com/article/twitter-to-release-all-tweets-to-scientists-a-trove-of-billions-of-tweets-will-be-a-research-boon-and-an-ethical-dilemma/
Thursday, October 29, 2015
Week #9 Blog
Essential Question: How will you go about making sense of your data?
“Collection and analysis should be a simultaneous process in qualitative research” (Merriam & Tisdell, 2015, pp. 195). I think this might be the main thing that stuck with me this week. It seems obvious, and was something I was already considering. The problem was all of my other duties have been interfering with the amount of time I can put into my research. I think this statement really made me build in some time to look at my data and try to start coding it. The first step of analysis will be to get familiar with my data. This means I need to read and re-read it (Taylor-Powell & Renner, 2003, pp.2). “Think of yourself as having a conversation with the data— asking questions of it, making comments to it, and so on” (Merriam & Tisdell, 2015, pp. 204). I found this statement to be very humorous and true. This will help me to code and interpret data as I go.
“Coding is nothing more than assigning some sort of shorthand designation to various aspects of your data so that you can easily retrieve specific pieces of the data” (Merriam & Tisdell, 2015, pp. 199). I have been trying to sort the tweets my students have been posting. This is a very tedious job, and I have come up with the plan of cutting and pasting for this. I have 4 main categories. I don’t think I could come up with any fewer. Merriam and Tisdell (2015) recommend using fewer categories because it makes it easier to share your results. (pp. 214)
Merriam and Tisdell (2015) also note that the categories should represent the purpose of your study (pp. 204).
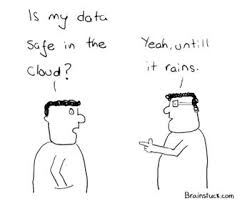
I plan to use content analysis where I will code for certain words and then interpret their meaning, as opposed thematic analysis. ("Analyze Qualitative Data Pell Institute", 2015). “After data has been collected, you will need to undergo a data reduction process in order to identify and focus in on what is meaningful” ("Analyze Qualitative Data Pell Institute", 2015). I do not plan to do much data reduction because I have not recorded every little thing. But I will have to do some reduction to make my data a little more manageable.
 |
| http://www.dedoose.com/blog/2013/02/text-analysis-and-the-cloud/ |
Near the end of chapter 9, the discussion turned to using computers to sort data. “The computer program only helps as an organizing or categorizing tool, and does not do the analysis for the researcher” (Merriam & Tisdell, 2015, pp. 221). Computers are also a great way to store your information and to create a backup copy. I have become a huge fan of using google for virtually everything and I don’t think I will change for this research project. Another great aspect of using computers is the ability to create visual representations. It is also much easier to change things around (Reademaker, Grace & Curda, 2012) .
References
Analyze Qualitative Data Pell Institute. (2015). Retrieved October 30, 2015, from http://toolkit.pellinstitute.org/evaluation-guide/analyze/analyze-qualitative-data/
Merriam, Sharan B.; Tisdell, Elizabeth J. (2015, July 6). Qualitative Research: A Guide to Design and Implementation (JOSSEY-BASS HIGHER & ADULT EDUCATION SERIES). Wiley. Kindle Edition.
Rademaker, L., Grace, E., & Curda, S. (2012). Using Computer-assisted Qualitative Data Analysis Software (CAQDAS) to Re-examine Traditionally Analyzed Data: Expanding our Understanding of the Data and of Ourselves as Scholars. The Qualitative Report, 17(43), 1-11. Retrieved from http://www.nova.edu/ssss/QR/QR17/rademaker.pdf
Taylor-Powell, E., & Renner, M. (2003). Analyzing Qualitative Data.University of Wisconsin-Extension. Retrieved from http://learningstore.uwex.edu/Assets/pdfs/G3658-12.pdf
The Cloud-Or...No, Your Text Analysis Does Not Get Wet When It Rains... (n.d.). Retrieved October 30, 2015, from http://www.dedoose.com/blog/2013/02/text-analysis-and-the-cloud/
Saturday, October 24, 2015
Week 8-Data Mining
Essential Question: How can data mining assist you in triangulating your research findings?
Data mining can help support what you hope to find. This can be especially useful if you don’t have the data you need to support your research. Data mining involves gathering data from any artifacts or documents that are available for review. These documents and artifacts can be online or in print. There is so much data available to people. It can be hard to figure out where to look with all of this data. Data mining helps a person to make meaning out of all the data that they find (Alexander). “Data mining is a means of automating part of this process to detect interpretable patterns; it helps us see the forest without getting lost in the trees” (Furnas, 2012). You can have tons of info with all of the data that is out there. This means you could be “information rich, but data poor” (Alexander).
“A qualitative study of classroom instruction would lead to documents in the form of instructors' lesson plans, student assignments, objects in the classroom, official grade reports and school records, teacher evaluations, and so on” (Merriam & Tisdell, 2015, pp. 175). There are many limitations and benefits to using documents or artifacts. The main limitations include authenticity and bias. (Merriam & Tisdell, 2015, pp. 181-182). Authenticity refers to some documents or artifacts being anonymous and because of this you cannot verify if they are credible or not. Bias is usually unintentional because the writer may not even realize they are including bias. Bias may come from the writer not remembering accurately as well. The main benefit is that many of these documents or artifacts are free and easy to get (Merriam & Tisdell, 2015, pp. 183). They provide much information without having to collect the information yourself. This benefit alone can override the above mentioned limitations. If you are in need of data, knowing where to find more can be very important. It is also important to figure out how to make meaning out of what you find. This becomes the most important task a researcher is faced with.
References
Alexander, D. (n.d.). Data Mining. Retrieved October 24, 2015, from http://www.laits.utexas.edu/~anorman/BUS.FOR/course.mat/Alex/
Furnas, A. (2012, April 3). Everything You Wanted to Know About Data Mining but Were Afraid to Ask. Retrieved October 24, 2015, from http://www.theatlantic.com/technology/archive/2012/04/everything-you-wanted-to-know-about-data-mining-but-were-afraid-to-ask/255388/
Merriam, Sharan B.; Tisdell, Elizabeth J. (2015, July 6). Qualitative Research: A Guide to Design and Implementation (JOSSEY-BASS HIGHER & ADULT EDUCATION SERIES). Wiley. Kindle Edition.
Friday, October 16, 2015
Week #7-Observations

Rationale:
First one chooses the type of observation they wish to do. The 4 types of observations are: complete participant, participant as observer, observer as participant, and complete observer (Merriam & Tisdell, 2015, pp. 140). Next you consider the setting. The setting should be as natural as possible (Merriam & Tisdell, 2015, pp. 137). While observing you should keep your focus on one category to observe. To do this you should have a systematic way to organize notes. Using a template can help you keep data organized and easy to record. With having this template it will also help in being selective. (Classroom Interactions). There is no possible way to write down everything you observe, so you must choose what you perceive to be the most valuable at the time. If you are an active participant in your observation you must also find a line between being totally absorbed and just participating (Merriam & Tisdell, 2015, pp. 146). If you are not video or audio recording and cannot write your notes while observing you must be sure to avoid talking to others before you record your notes. Merriam & Tisdell (2015) note that talking before recording can “diffuse importance.”
Why should observation be done in a classroom? Observation is most commonly used to improve classroom management and instructional techniques (Hidden Curriculum). It has been noted to cut down on misbehavior, make students more independent, allowing students to accomplish more, and for teachers to learn more about students . To be able to observe effectively it “requires sharp, vibrant lesson, spot on directions, and prove it to me checking for understanding before releasing students to work” (Linsin, 2015). If you don’t do this, you will be so absorbed in teaching and helping students that you would never be able to observe what is happening in the classroom.
References
Classroom Interactions. (n.d.). Retrieved October 15, 2015, from http://fcit.usf.edu/assessment/classroom/interactb.html
Hidden curriculum (2014, August 26). In S. Abbott (Ed.), The glossary of education reform. Retrieved from http://edglossary.org/hidden-curriculum
Linsin, M. (2012, December 15). Why You Should Observe Your Students More. Retrieved October 15, 2015, from http://www.smartclassroommanagement.com/2012/12/15/why-you-should-observe-your-students-more/
Merriam, Sharan B.; Tisdell, Elizabeth J. (2015, July 6). Qualitative Research: A Guide to Design and Implementation (JOSSEY-BASS HIGHER & ADULT EDUCATION SERIES). Wiley. Kindle Edition.
Thursday, October 8, 2015
Week 6-Interviews
Essential Question: What are the most important things to remember in conducting interviews?

Interviews are a “conversation that has structure and purpose” (Merriam & Tisdell, 2015, pp. 108). To conduct an interview one needs to be prepared. According to McNamara (1998), you need to first choose a setting that will provide little distraction. Next you will need to plan how you will explain what you are doing and what the process will be like. Then you will need to decide how you will remember what the interviewee tell you. You could either choose to record the person, take notes during the interview or record as much as possible once the interview is over (Merriam & Tisdell, 2015, pp. 130-131).
Next you will need to choose the type of interview you wish to use. Holm-Hansen and Merriam & Tisdell both outline the 3 types. There is the highly structured interview in which “all respondents are asked exactly the same question and provided with a consistent set of response options” (Holm-Hansen, 2007). The second option falls in the middle, the semi-structured interview. In this type the same type of information is collected but they way the questions are asked may differ. In the 3rd type, informal, there are no predetermined questions. This is mostly used to explore a topic.
There are 6 kinds of questions an interviewer is recommended to ask. The first is behavior questions, to think about what a person does. The 2nd type of question is opinion type questions where you ask about how a person thinks about something. The 3rd type is feeling where you ask how someone feels about the topic. The 4th type is knowledge where you are trying to figure out what they know. The 5th type is sensory where you want to know about what was seen, heard, felt, or touched. The final type of question is background or demographics (Merriam & Tisdell, 2015, pp. 118).
Next you want to consider how you ask your questions. According to McNamara (2015) questions should be open-ended, neutral, asked one at a time, worded clearly, and one should be careful in asking “why” questions. The “why” questions can lead to a dead end if there is no relationship or it could cause the interviewee to get defensive.
After going through all of this you should be able to have a complete interview schedule. One reason to do an interview is that “interviews, are believed to provide a 'deeper' understanding of social phenomena than would be obtained from purely quantitative methods, such as questionnaires” (Gill, Stewart, Treasure & Chadwick, 2008). Interview allow the interviewer to probe for more information from the interviewee to provide a more complete picture. Basically you can be sure you get the information you need for your study. A couple of downfalls include the interviewer influencing the interviewee and that recording and transcribing can be very time consuming and expensive (Holm-Hansen, 2007).
References
Gill, P., K. Stewart, E. Treasure, and B. Chadwick. "Methods of Data Collection in Qualitative Research: Interviews and Focus Groups." Nature.com. Nature Publishing Group, 22 Mar. 2008. Web. 9 Oct. 2015. <http://www.nature.com/bdj/journal/v204/n6/full/bdj.2008.192.html>.
Holm-Hansen, C. (2007). Tips for Conducting Program Evaluation.Conducting Interviews, (11). Retrieved October 9, 2015, from https://www.wilder.org/Wilder-Research/Publications/Studies/Program Evaluation and Research Tips/Conducting Interviews - Tips for Conducting Program Evaluation Issue 11, Fact Sheet.pdf
McNamara, C. (1998). General Guidelines for Conducting Research Interviews. Retrieved October 9, 2015, from http://managementhelp.org/businessresearch/interviews.htm
Merriam, Sharan B.; Tisdell, Elizabeth J. (2015, July 6). Qualitative Research: A Guide to Design and Implementation (JOSSEY-BASS HIGHER & ADULT EDUCATION SERIES). Wiley. Kindle Edition.
Friday, October 2, 2015
Week #5
Essential Question: How will data collection ‘look’ for me? What challenges am I anticipating?
Before I start collecting data I want to make sure all students understand how to use Twitter, and to go over the ground rules. Abe & Jordan (2013) suggest teaching students how to use social media to make its implementation more effective. My data collection will include the tweets sent with #nisbio. I will be focusing on 9 students who are in biology and physical science.
For the class I will use Twitter in, biology, I have given the students a list of what they can tweet about. They can either post what they learned, ask a question, post a resource (such as a video, article, picture, etc.), tell what they want to learn about next, or anything else related to class. I will separate tweets into 4 categories: learning, questions, resources, and a miscellaneous category for any other comments. The miscellaneous category may get thrown out later because I’m not quite up to full speed on Twitter yet, and I don’t know what other types of things my students could decide to post. If students post other types of useful things I will be inclined to include the data in my research. I plan to require students to post something before they leave class, maybe a sort of exit ticket.I will then give bonus points to students who comment on other students posts in a way that is meaningful to the class. I will also allow students to post throughout class as well, but they will only be required to post once each day. At least once a week I would like to include a wordle to further promote discussion, as suggested by Costa, Beham, Reinhard, and Sillaots (2008). I also hope to administer a survey asking students about how they feel about using Twitter in class. I would like to administer a pre and post survey to see if student perception of Twitter use in class changes.
In physical science I will be making notes about how many comments these 9 students make in class. I will eliminate all comments and tweets that are not related to class.
Then, I will tally up comments in the 4 categories, used for Twitter, for the 9 students I will be collecting data on. I will focus on one student each day, because this project will be four weeks, I should have 2 days of data for each student. If for any reason a student's data does not seem to match for the 2 days, I will either throw them out or try to collect more data if I can. I know I will probably not have the best data for this part, but I realize that I cannot collect data on all students everyday because it would take too much of my focus away from the class. At the conclusion of this 4 week period I would like to talk with each of the 9 students to see their thoughts on using Twitter.
The goal of all of this is that my students will learn how to post respectfully, and “deeply consider ideas in real time,” all in 140 characters or less. (Wynter, 2014) This is a skill that they will need in the future, as society becomes more digital. I also hope students will realize that what they post is global. They can reach people in all parts of the world.
References
Abe, P., & Jordan, N. (2013). Integrating Social Media Into the Classroom Curriculum. About Campus, 18(1), 16-20.
Costa, C., Beham, G., Reinhardt, W., & Sillaots, M. (2008, December). Microblogging in technology enhanced learning: A use-case inspection of PPE summer school 2008. In Proceedings of the 2nd SIRTEL’08 Workshop on Social Information Retrieval for Technology Enhanced Learning Maastricht, Netherlands.
Wynter, Amanda. "Bringing Twitter to the Classroom." The Atlantic. Atlantic Media Company, 15 Sept. 2014. Web. 2 Oct. 2015. <http://www.theatlantic.com/education/archive/2014/09/the-case-for-having-class-discussions-on-twitter/379777/>.
Thursday, September 24, 2015
Literature Review-Using Twitter in the Classroom
Twitter, when intentionally integrated into the classroom, can promote higher engagement of students in the classroom. In a study done by Junco, Heiberger, & Loken (2010) they found that using Twitter heightened engagement, and that the average GPA of those who used Twitter was about 0.5 points higher. They concluded that, “using Twitter in educationally relevant ways can increase student engagement and improve grades.” Another study done 2 years later by Junco, Elavsky, & Heiberger (2012) concluded 3 main ideas from the use of Twitter. The first, is that when students are required to use Twitter there is an increase in student engagement, compared to students who were allowed to make a to choice on whether to use Twitter or not. They also concluded that faculty who engaged their students on Twitter saw a higher level of academic gains in their students. Finally they found “having a theoretical reason to use Twitter and implementing that reason into the course pedagogy will maximize the benefits achieved.” Another study done by Birnholtz, Hancock, & Retelny (2013), found that students were engaged when lecture contained slides with their tweets and 90% recommended it should be used again.
There is not a lot of research completed, right not, because the use of Twitter in education is a fairly new idea. “There is a growing body of scholarly research suggesting that, when used properly, social media can boost both learning outcomes and student engagement. The key phrase in that sentence is ‘when used properly.’ The problem is that research in this area is still relatively limited, and most of what is being done in classrooms is experimental. No one has figured out definitively what does and does not work” (Copeland 2012). It is important to note that not all students are at the same level of understanding in using Twitter. Therefore, one way to effectively use Twitter is to “instruct students in using social media critically and intentionally to optimize learning outcomes” (Abe & Jordan, 2013). In the study done by Copeland (2012), it was noted that students who were reluctant to use Twitter tended to struggle more than those who adopted the use of Twitter.
There are many concerns about using Twitter. A top concern about Twitter, or other social media sites, is that is could distract students from content. (Novak & Cowling, 2010). Another concern is that there could be some disconnect between Twitter and the class itself. “They almost act as two separate parts of class and don’t always connect, it can be confusing at times” (Miami Student, 2013). Instructors could also fear that Twitter might “encourage bad grammar as a result of its 140-character limit, or that it could become time-consuming and addictive (Dunlap, 2009).
There are also many positives noted when Twitter is used effectively. According to Dunlap and Lowenthal, you can get instant answers or feedback (Tweeting, 2009). In another article by Dunlap and Lowenthal, they conclude that interactions on Twitter are more natural and occur quicker than using discussion boards (Instructional, 2009). Something that really intrigues me is that “students are getting the idea that their community of learners can extend outside of the classroom” (Messner, 2009). In the study done by Birnholtz, Hancock, & Retelny (2013), that I mentioned earlier, “students applied course concepts to examples from their lives (2009: 57%; 2010: 68.6%; 2011: 62.6%).” Classroom shyness can be a huge issue, but Twitter may help with that. “Students in another Twitter-friendly classroom at Purdue University agree that digital communication helps overcome the shyness barrier. Studies frequently discover that greater participation translates into better academic performance, motivation, and a likelihood of adopting different points of view, which is why it is so striking that Twitter can foster that type of communication’” (Fernstein 2010).
The intended purpose of my study is to see how Twitter impacts quiet students. The question I will base my study around is will Twitter would help shy students to find their voice in the classroom? I plan to use Twitter in my Biology class and compare it to my Physical science class. I have about 10 students who are in both classes and I would like to target these students. Some of these 10 are quiet, and some tend to be louder. I would like to see how the quiet students contribute to biology class, and see if they add more to our class than in physical science. To further promote discussion I plan to use the Twitter discussion to create wordles as suggested by Costa, Beham, Reinhard, and Sillaots (2008). According to their research they found that wordles helped provide a quick visualization of the tweets to figure out what was missing from the conversation. It can also be a quick reference for what seemed to be the most important topic for discussion online.
References
Abe, P., & Jordan, N. (2013). Integrating Social Media Into the Classroom Curriculum. About Campus, 18(1), 16-20.
Birnholtz, J., Hancock, J., & Retelny, D. (2013). Tweeting for Class: Co-Construction as a Means for Engaging Students in Lectures. Retrieved September 23, 2015, from http://socialmedia.northwestern.edu/files/2012/09/twitternote_revision_CHI13_130123_camready_a3.pdf
Copeland, D. (2012, May 2). For Social Media In The Classroom To Work, Instructors Need Best Practices. ReadWriteWeb.com (USA). Retrieved from http://infoweb.newsbank.com/resources/doc/nb/news/142FE842413B5A78?p=AWNB
Costa, C., Beham, G., Reinhardt, W., & Sillaots, M. (2008, December). Microblogging in technology enhanced learning: A use-case inspection of PPE summer school 2008. In Proceedings of the 2nd SIRTEL’08 Workshop on Social Information Retrieval for Technology Enhanced Learning Maastricht, Netherlands.
Dunlap, J. C., & Lowenthal, P. R. (2009). Instructional uses of Twitter. The CU online handbook, 45.
Dunlap, J. C., & Lowenthal, P. R. (2009). Tweeting the night away: Using Twitter to enhance social presence. Journal of Information Systems Education,20(2), 129-135.
Ferenstein, G. (2010, Mar 1). How Twitter in the Classroom is Boosting Student Engagement. Mashable.com. Retrieved from http://infoweb.newsbank.com/resources/doc/nb/news/136E18096E162FF0?p=AWNB
Junco, R., Elavsky, C., & Heiberger, G. (2012). Putting twitter to the test: Assessing outcomes for student collaboration, engagement and success. Br J Educ Technol British Journal of Educational Technology,44(2), 273-287.
Junco, R., Heiberger, G., & Loken, E. (2010). The effect of Twitter on college student engagement and grades. Journal of Computer Assisted Learning, 119-132. Retrieved September 5, 2015, from http://www.ferris.edu/htmls/adm
Messner, K. (2009). Making a case for Twitter in the classroom. School Library Journal.
Miami Student. (2013, Nov 5). A new way to have #class: Professors incorporate social media in curriculum. The: Miami University (Oxford, OH). Retrieved from http://infoweb.newsbank.com/resources/doc/nb/news/149E3B7FE7567328?p=AWNB
Novak, J., & Cowling, M. (2011). The implementation of social networking as a tool for improving student participation in the classroom. In ISANA International Academy Association Conference Proceedings (Vol. 22, pp. 1-10). Auckland, NZ: ISANA International Education, Inc.
Subscribe to:
Posts (Atom)